A look at some Tweets from Thanksgiving 2015
Overview
Twitter is great. Behind all those tweets, there is an enormous amount of data that holds many interesting facts, and opinions of almost any subject from people all around the world.
During Thanksgiving 2015 (November 26), while everyone was eating turkey, I fired up Spark to capture tweets containing the keyword ‘thanksgiving’.
The reason I did this work was because I was interested in exploring the tweets generated during that period of time, principally the tops hashtags, mentions and retweets. Moreover, I wanted to try Apache Zeppelin, a web-based notebook (similar to iPython or Jupyter) for interactive data analytics.
Note: Because this report has some images, I changed the layout of this page for better visibility of them.
The data
The dataset used is made of 177955 tweets obtained on November 26, 2015.
Platforms used
- Apache Zeppelin and the Spark interpreter
- Spark Streaming
- Pig
Report
Obtaining the data
The data used for this work was obtained using Spark Streaming, and its Twitter library. The script written captured only the text component of the tweet, in other word, just the tweet itself. After an hour or so of capturing tweets, I ended up with a directory made of many subdirectories that had the tweets. Because of this, a Pig script was written to transfer the content of all these files into a single one. Both of these scripts are on the GitHub repository of this project.
This is an example of a single tweet: Macy's Thanksgiving day parade never gets old #HappyThanksgiving
The result
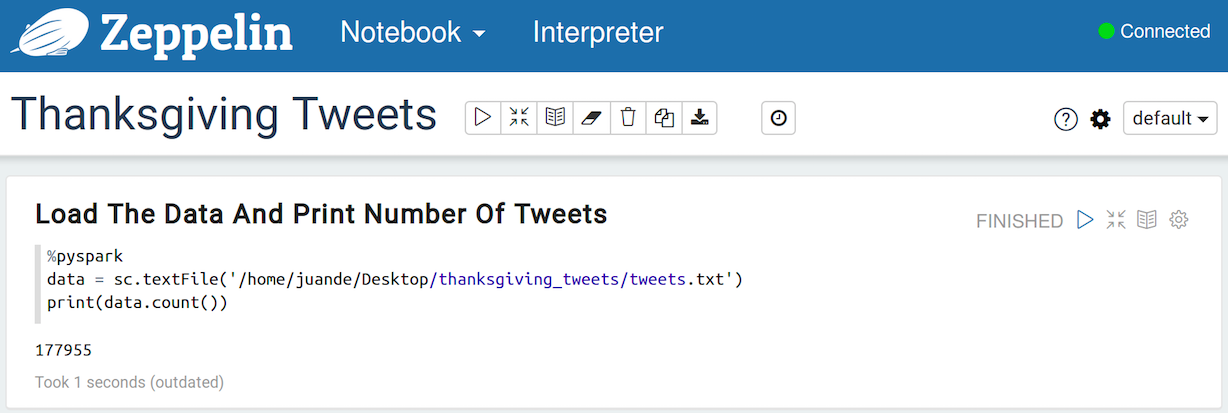
Once the data was in the wanted format, it was loaded into Zeppelin. Keep in mind that I used the Spark interpreter, meaning that the syntax you will see in the following images are Spark code, or Pyspark to be more specific.
The following screenshots (taken from the Zeppelin notebook) shows how the data was loaded, and the number of tweets available in the dataset, 177955.
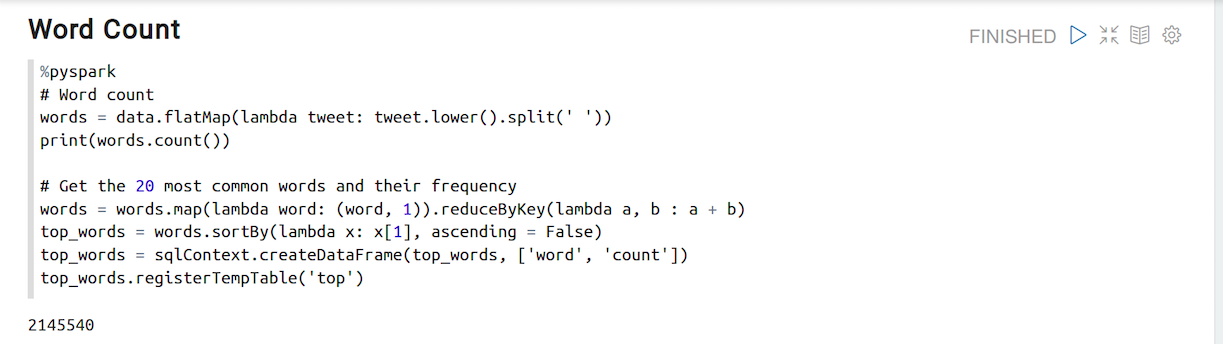
After counting the number of tweets, I executed the flatMap action on my data structure (RDD to be precise) to get every single word of the corpus as an element of the RDD, followed by a reduceByKey action to count them - the total number of words is 2145540. Then a new dataframe, made of the words and their frequency, was created. The next images display the code written to achieve this, and a bar chart and table that presents the top 10 words. This bar chart and table are merely the output of an SQL query (also shown in the images).
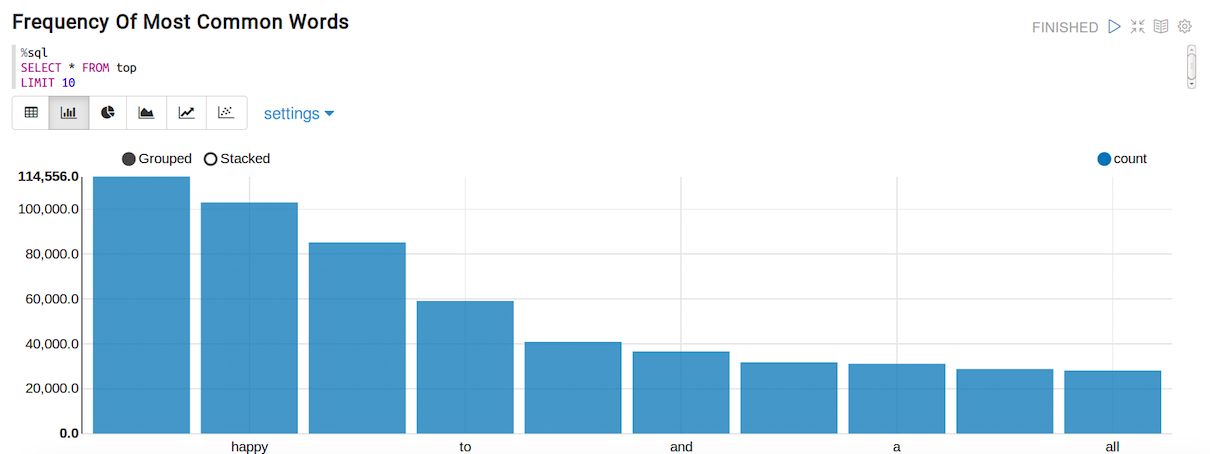
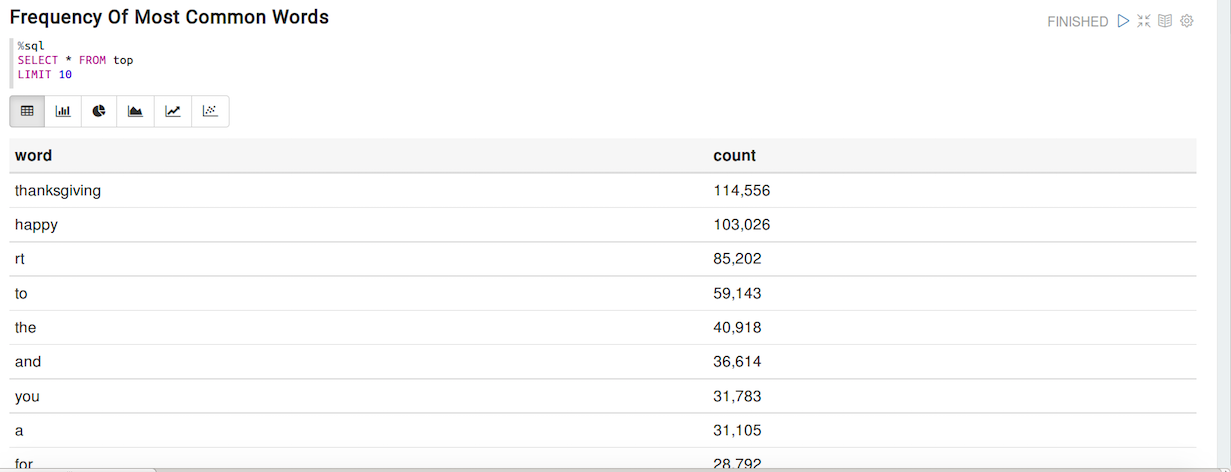
These are the top 10 words and their frequency
- thanksgiving: 114,556
- happy: 103,026
- rt: 85,202
- to: 59,143
- the: 40,918
- and: 36,614
- you: 31,783
- a: 31,105
- for: 28,792
- all: 28,089
Is not surprising that the most common words are "thanksgiving" and "happy".
Something really cool about Zeppelin is that you can change the view of the output of an SQL query by just clicking one of the small icons below the query editor. Some of these views include a regular table (as seen on the previous image), a bar chart, a pie chart and others.
Now that we know what the most common words are, lets do the same but with the hashtags.
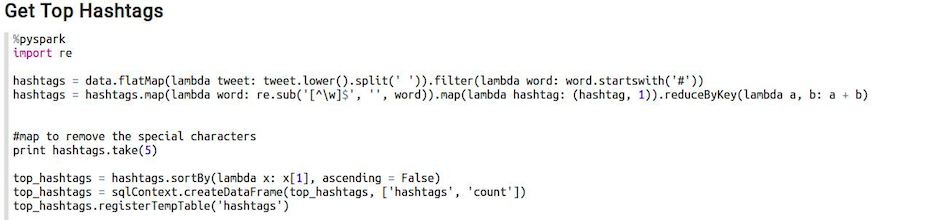
The next image shows the code used to get the hashtags. Most of the actions performed at this step are similar to those used to find the most common words, the exception in this case is that I used a regex to remove the special characters that follow a hashtag. For example, someone on Twitter might write #thanksgiving! as one word, but Twitter does not allow numbers or special characters on the hashtags, so the hashtag is just #thanksgiving - the ! is just a normal character of the tweet.
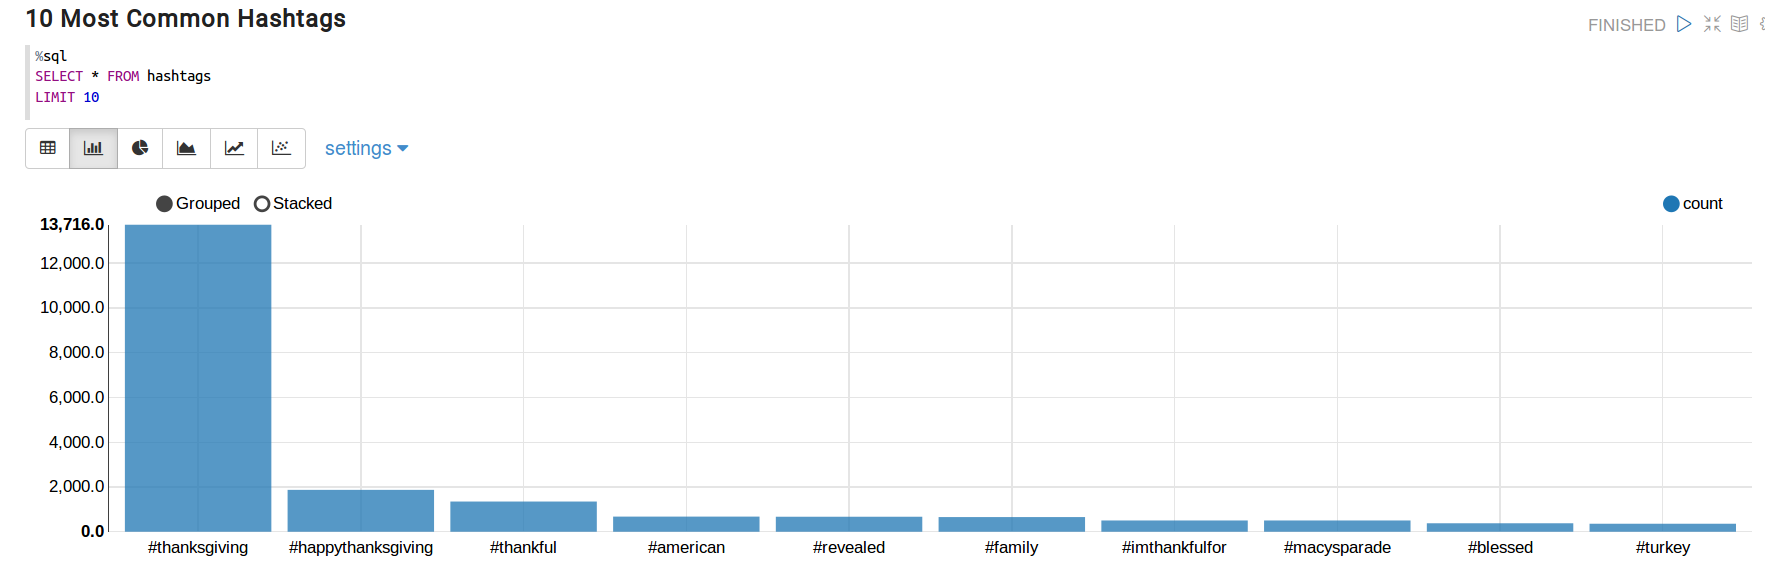
These are the top 10 hashtags:
- #thanksgiving: 13,716
- #happythanksgiving: 1,871
- #thankful: 1,350
- #american: 677
- #revealed: 672
- #family: 657
- #imthankfulfor: 504
- #macysparade: 504 (call me skeptic but I do not like that there are two hashtags with the same count)
- #blessed: 380
- #turkey: 359
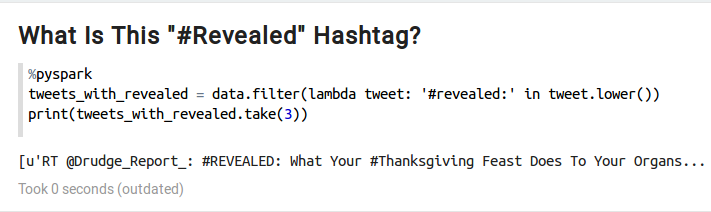
There is one hashtag from this list that feels out of place. Do you agree? That is the hashtag #revealed. This hashtag belongs to a tweet from an account called @Drudge_Report that starts like this "#REVEALED: What Your #Thanksgiving Feast Does to Your Organs... Avg #American Will Consume 4,500 Cals...". Mystery solved.
So far we have discovered the top words, and the top hashtags, and now it is time to find the most common mentions.
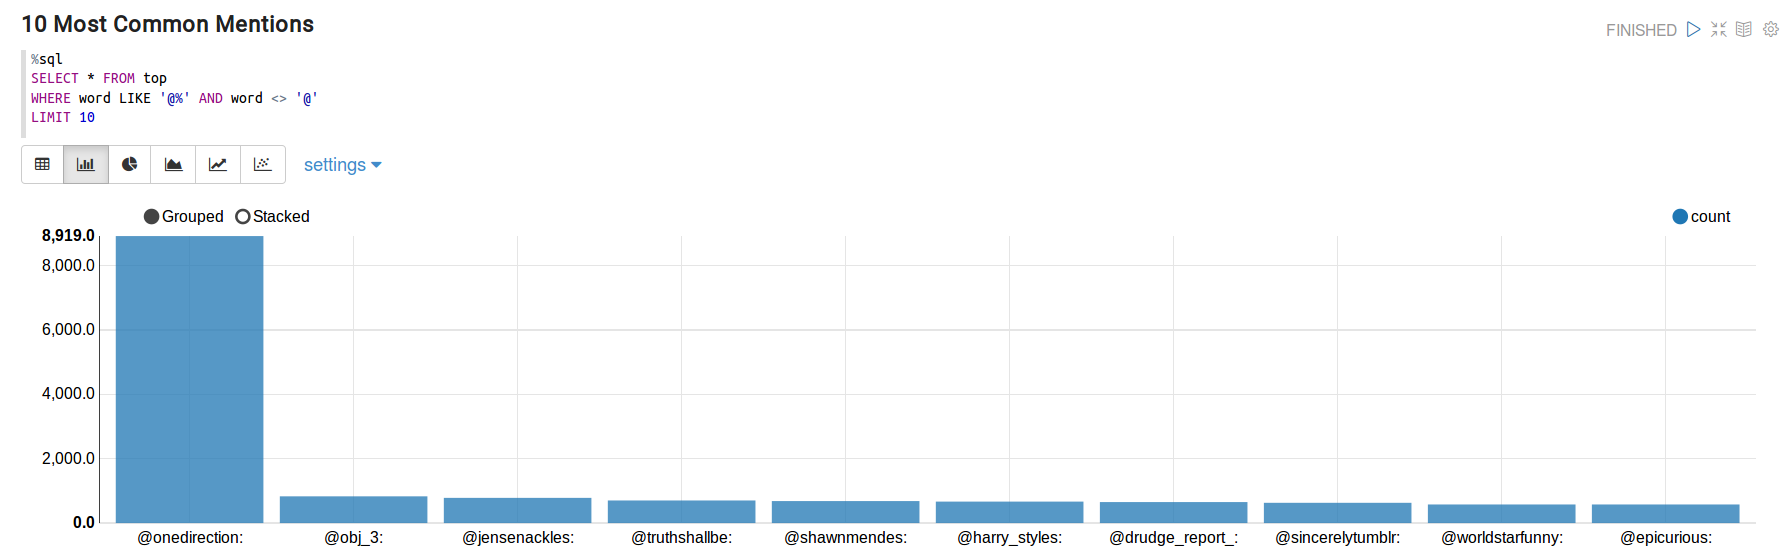
- @onedirection: 8,919
- @obj_3: 831
- @jensenackles: 783
- @truthshallbe: 701
- @shawnmendes: 684
- @harry_styles: 666
- @drudge_report_: 651
- @sincerelytumblr: 630
- @worldstarfunny: 578
- @epicurious: 577
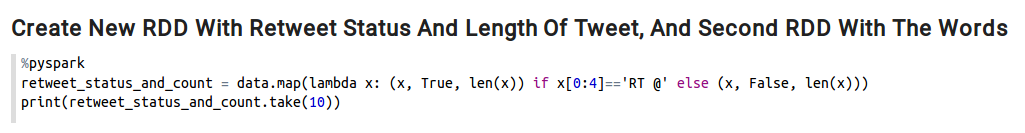
The last section of this report is related to the retweets. As I did before with the hashtags and mentions, I looked for the five most common retweets, and the number of time they were reposted.
The process behind this was a bit different than we I did before, mostly because I had to check each tweet to verify if it is in fact, a retweet. Thus I called themap function on my original dataframe, and checked if the first characters of the tweet are RT @. The result of this map action is a new dataframe made of a tuple of 3 elements: the tweet, the retweet status, and the length of the tweet (you will see why soon).
A second dataframe was created with just those tweets that are retweets. Followed by this, they were counted using reduceByKey.
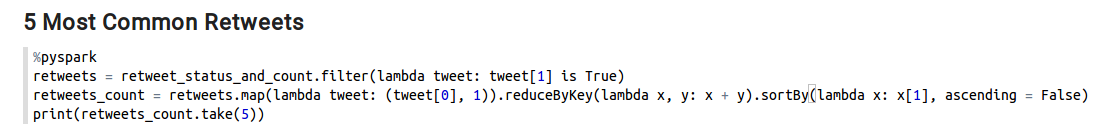
- RT @onedirection: Happy Thanksgiving to all our US fans!: 8917
- RT @OBJ_3: Happy Thanksgiving yall. Have a blessed day!: 830
- RT @JensenAckles: Happy Thanksgiving y'all!!!! I love PIE!!!: 783
- RT @truthshallbe: Happy Thanksgiving to All. May the Lord be with you, and Bless you All, and the family. God Bless our Troops.: 701
- RT @ShawnMendes: GOODMORNING! HAPPY THANKSGIVING! love you guys \u2764\ufe0f: 676
Note: Some of these retweets had a URL on them and I removed them.
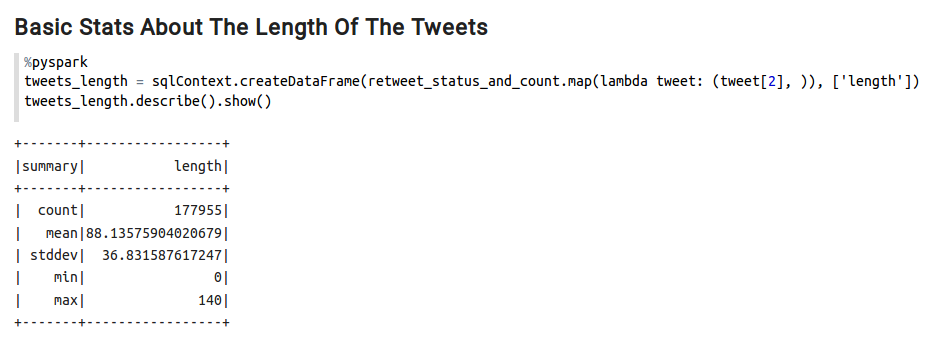
BONUS! This is why I added the length of the tweets.
Conclusion
Turkey, Macy's Parade, One Direction and good times. This is what was revealed by the tweets I showed in this report. Moreover, I had the chance of trying Zeppelin, which I found really intuitive and easy to use. The scripts, an export of the Zeppelin notebook, and the dataset is available at the repository of this project (link is at the footer of this page).